Mapping the deep: the application of predictively modelled maps to European spatial planning
|
Project Acronym &Title: DeepMap – Mapping the deep: the application of predictively modelled maps to European spatial planning |
   |
|
Dr Kerry Howell, Plymouth University, UK |
 |
Main Objectives
The main objective of this cruise was to test the accuracy of predictively modelled maps of the distribution of 2 Vulnerable Marine Ecosystems (VME): aggregations of the glass-sponge Pheronema carpenteri, and cold water coral reefs, in European waters. The predictive power of two previously published habitat suitability models of different resolution was tested (Ross & Howell 2013 -750m resolution, Ross et al. 2015 – 200m resolution). This is likely the first deep-sea cruise for the purpose of habitat suitability model validation acquiring specifically targeted independent data. Secondary objectives included: I. investigation of the role played by Colour Dissolved Organic Material (CDOM) in the optical dynamics of oceanic waters. ii. Measure bacterial and picophytoplankton abundance. iii. Study Radon concentration in the water column. iv. Collect samples of Pheronema carpenteri and other deep-sea sponges for taxonomic, genetic, biodiscovery, and silicate analysis. v. Obtain in-situ images and physical voucher specimens of structural sponge species. iv. Trial collection of live specimens of sponges for aquaria.
Work progress and main achievements
|
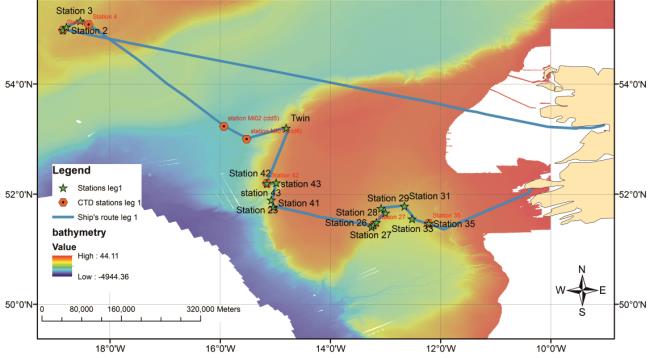
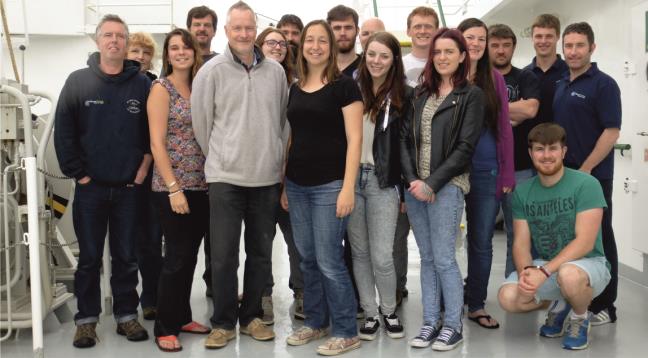
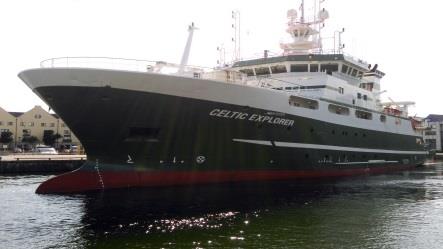
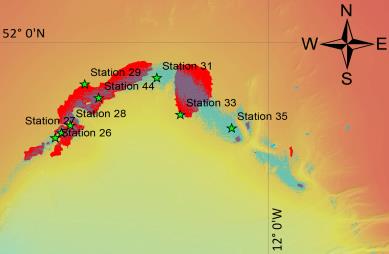
We launched from Galway in Ireland on 15th July 2015, straight into stormy weather which did not help many scientists to get their sea legs! 3 ROV transects and 3 CTD deployments were undertaken in the Hatton Rockall Basin before the weather worsened again and required we transit back to Porcupine Bank, unfortunately resulting in the omission of planned sites on Rockall Bank which were also affected by the weather system. A further 13 ROV transects and 5 CTD deployments were carried out on Porcupine Bank and in the Porcupine Seabight. This sampling regime resulted in the discovery of four new cold water coral reef sites, and re-confirmed the existence of large sponge aggregations in the Porcupine Seabight. Marine optics: To study the optical properties of Colour Dissolved Organic Material (CDOM) many samples of seawater obtained from the CTD were filtered and then analysed with a spectrometer. This data will increase our understanding of the role that these light absorbing compounds play in the optical dynamics of coastal and oceanic waters. Animals collected: 35 samples of the deep-sea glass sponge Pheronema carpenteri were obtained for population genetic analysis, and 31 samples for silicate analysis. In addition, various samples of other sponges (including Hyalonema sp. and Aphrocallistes sp.) corals (live and dead Lophelia pertusa and Solenosmillia variabilis) and other benthic fauna associated with the VMEs were taken for species verification. None of the animals attempted to be kept in aquaria survived; it is unknown whether they were alive upon arrival at the surface. Fluorescein experiments: Harmless fluorescein dye was dissolved in seawater and stored in an airtight bag with a weight on top. A simple hose with a handle (so that it could be grabbed or kinked by the ROV) was used to deliver dye at the base of Pheronema carpenteri and Hyalonema sp animals in situ. Preliminary observations showed that sponge pumping could be detected in these deep-sea sponges (see video), and that it is probably slower than in shallow water animals. Furthermore animals prodded with the hose in advance of delivery took a lot longer to pump the dye suggestive of a behavioural response when disturbed. Administering dye is a useful method to determine whether individual sponges were alive or dead. This was a proof of concept and can be used in the future to measure sponge pumping rates in the deep-sea. Training students: 4 PhD students and 6 undergraduate students had the experience of a lifetime through joining the cruise, and others have benefited back on land through undertaking student projects using the data collected. Overall, the cruise was considered a great success. |
 |
For more information:
http://deepseacru.org/ for information about the Plymouth University team and their work. https://www.youtube.com/channel/UCIGfSpnvic5lz59Rq82v0oA for cruise video clips